
Some views of home assistant generated data and reports
Here is an example of production data from the solar tracker using MQTT for tracker management and Shelly for consumption / production analysis.
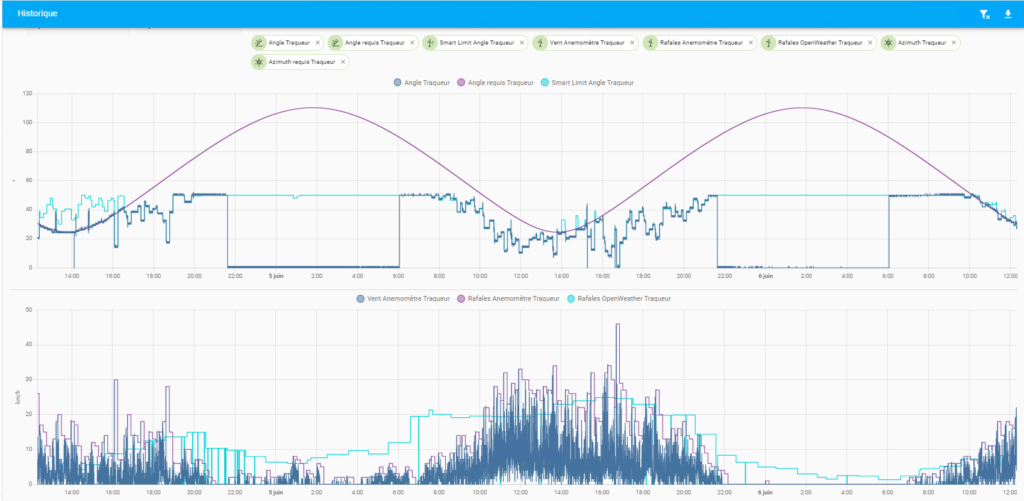
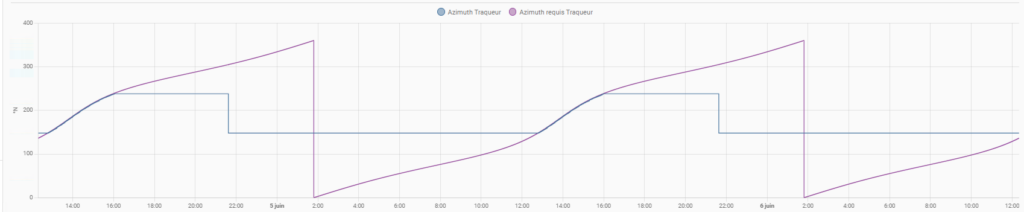
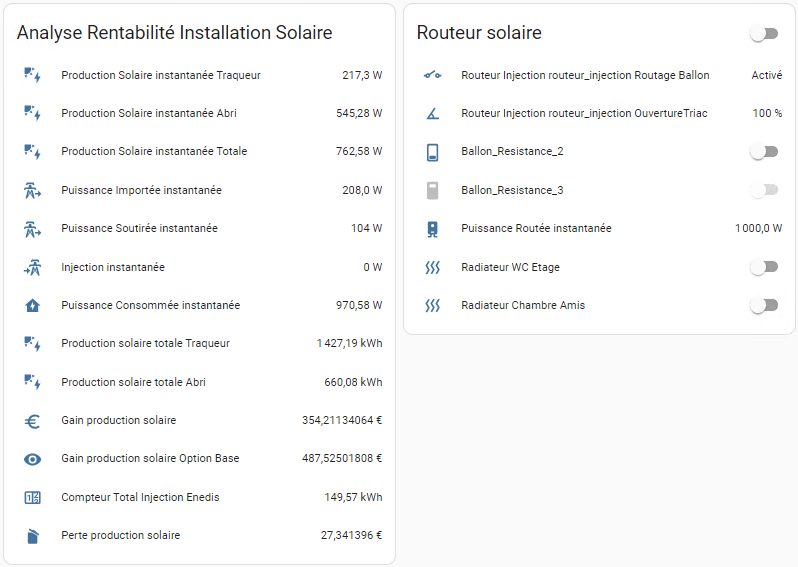
Tracker data (in french):
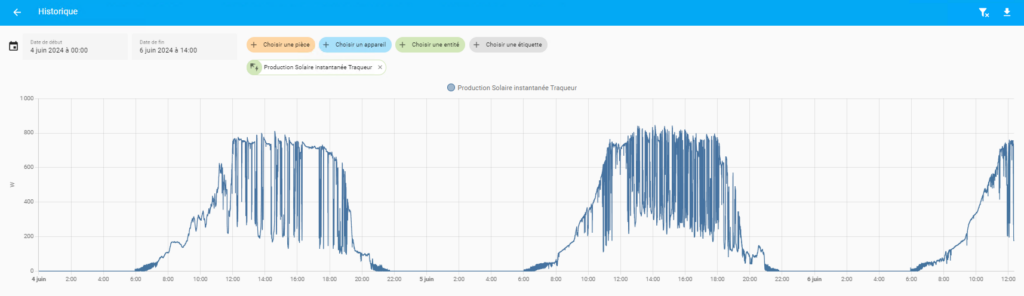
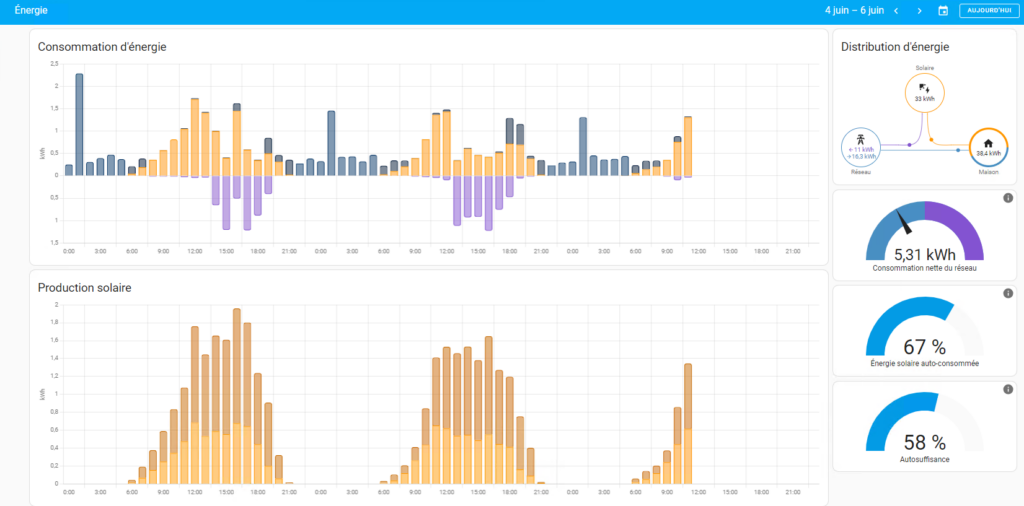
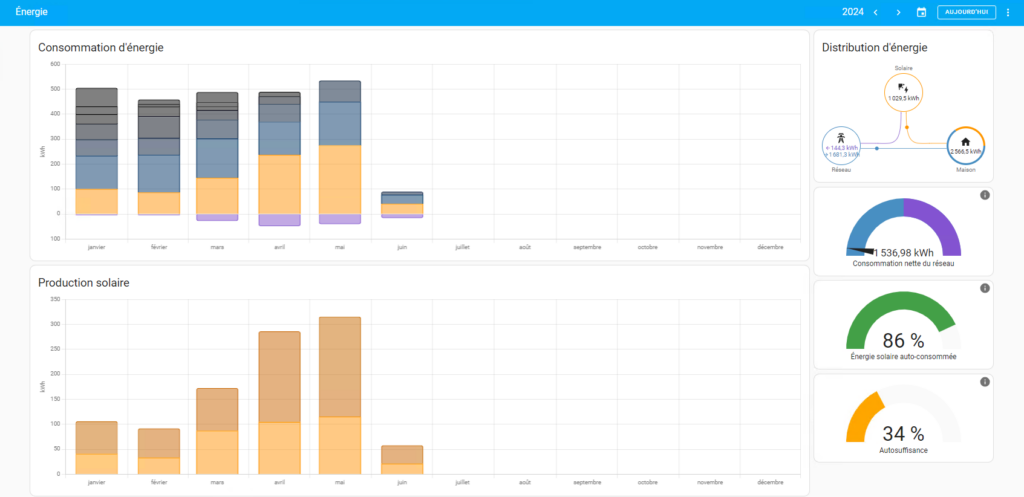
Production data (in french) :
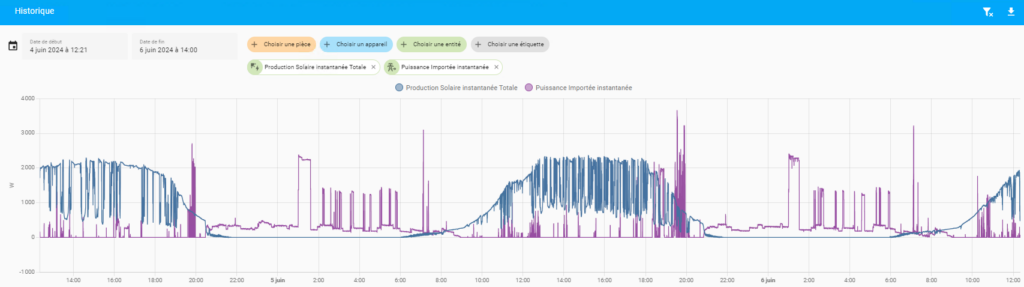
Tracker vs roof panels :

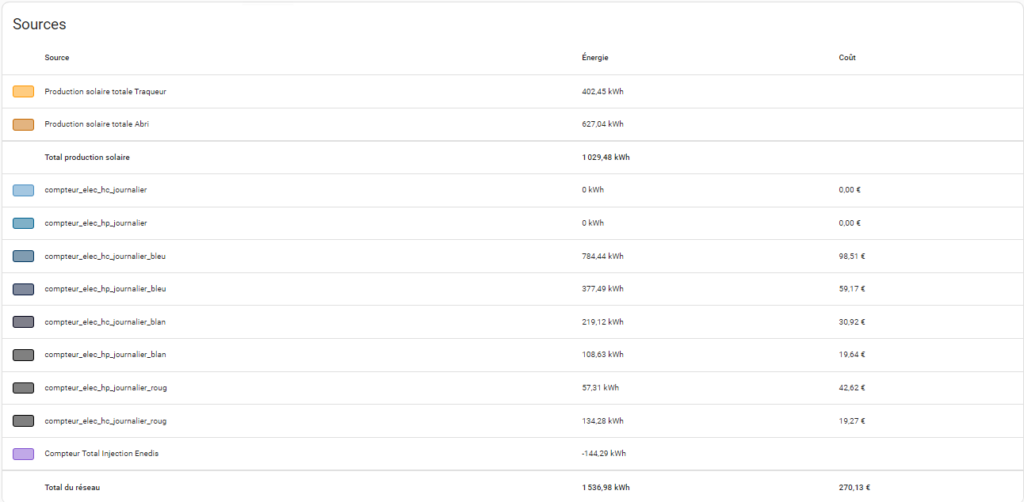
As you can see tracker panels production is way better than roof panels.
403 kwh for 800w of tracker panels vs 627kwh for 1500w of roof panels.
Production 0.5037 / watt crete of tracker panel
Production 0.418 kwh / watt crete of roof panel
Tracker production is better by about 20% versus static panels.


Leave a Reply